Research Behind Innprint.net
This page collects the full project in one place: the family-motel case study, the 21-owner survey, the original Google Forms charts, the questions asked, and the outside research used to understand the results.

Three Layers of Research
I started with a problem my family actually experienced, tested it against other hotel and motel owners, and then compared what I found with outside academic and industry research.
Family Motel Case Study
I recorded the number of fixtures on our property, what breaks, what replacements cost, what I could 3D print, and how far we travel for supplies.
21-Owner Survey
I asked hotel and motel owners about maintenance spending, replacement parts, ordering delays, technology access, and interest in 3D printing.
Outside Research
I reviewed research on hospitality maintenance, rural business constraints, distributed manufacturing, 3D-printer economics, and environmental impact.
What the 21 Responses Showed
The survey focused on the operating realities of smaller lodging businesses and whether 3D printing could fit those realities.
Charts rebuilt from documented values
Do Owners Know About 3D Printing?
52.4% answered yes, 38.1% no, and 9.5% maybe.
- Yes — 11 of 21 responses (52.4%)
- No — 8 of 21 responses (38.1%)
- Maybe — 2 of 21 responses (9.5%)
| Answer | Responses | Share |
|---|---|---|
| Yes | 11 of 21 | 52.4% |
| No | 8 of 21 | 38.1% |
| Maybe | 2 of 21 | 9.5% |
Are Broken Parts Usually Universal?
95.2% reported that broken parts were usually universal rather than hotel-branded.
| Answer | Responses | Share |
|---|---|---|
| Usually universal | 20 of 21 | 95.2% |
| Branded to the hotel | 1 of 21 | 4.8% |
How Far Is the Closest Hardware Store?
All survey respondents selected 0–25 miles for the closest hardware store.
| Distance | Responses | Share |
|---|---|---|
| 0–25 miles | 21 of 21 | 100% |
| Any longer distance | 0 of 21 | 0% |
Original project charts
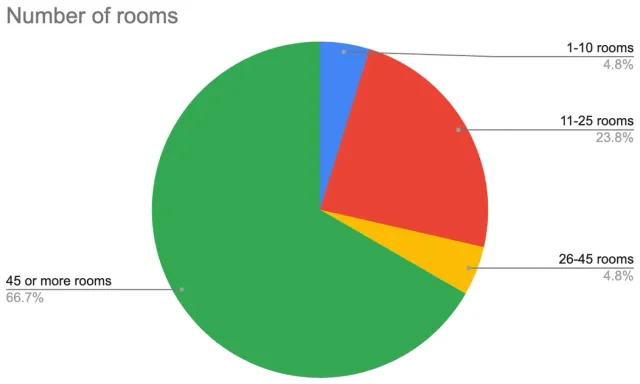
Chart values in text
- 45 or more rooms — about two-thirds of the 21 respondents.
The project research documents the two-thirds figure but not an exact count for every room-size band, so the original chart is kept unchanged.
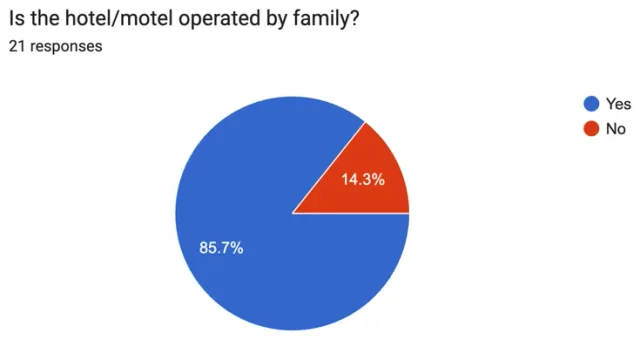
Chart values in text
- Family-operated — 85.7% of 21 respondents.
Only the 85.7% figure is documented in the project research, so the original chart is kept unchanged.
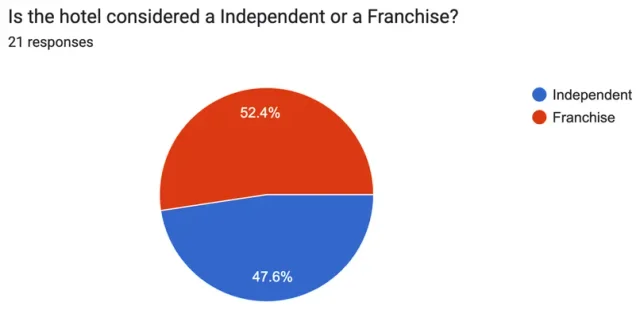
Chart values in text
- Responses included both independent properties and franchises.
The project research does not document per-category counts for this question, so the original chart is kept unchanged.
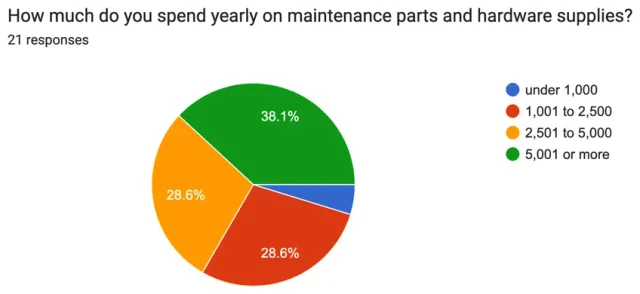
Chart values in text
- Responses are spread across four annual spending bands.
- The largest single group reported spending $5,001 or more each year.
- A large share of respondents fell in the $2,501–$5,000 and $5,001+ ranges.
- The written project summary says 13 of 21 respondents spend more than $2,500 per year. The original chart visually totals 14 of 21 across the $2,501–$5,000 and $5,001+ categories. Both figures are preserved exactly as recorded.
Because of the documented 13-of-21 versus 14-of-21 discrepancy, this chart is deliberately not redrawn.
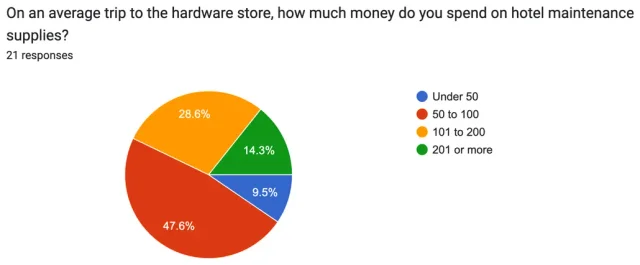
Chart values in text
- $50–$200 per trip — reported by most owners.
The project research does not document per-category counts for this question, so the original chart is kept unchanged.
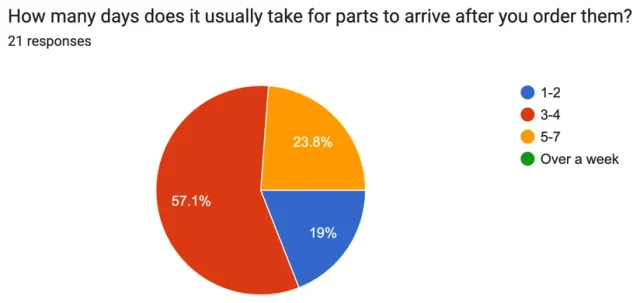
Chart values in text
- 3–4 days — reported by most respondents.
- 1–2 days — reported by some respondents.
- 5–7 days — reported by some respondents.
The project research does not document exact counts for each shipping band, so the original chart is kept unchanged.
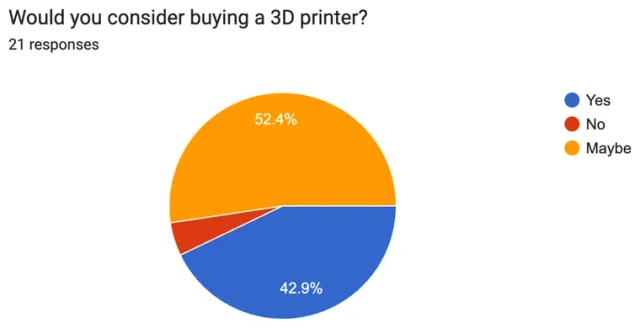
Chart values in text
- Yes — 42.9% of 21 respondents.
- Maybe — 52.4% of 21 respondents.
- No — only a small minority of respondents.
The exact value for the “no” category is not documented in the project research, so the original chart is kept unchanged.
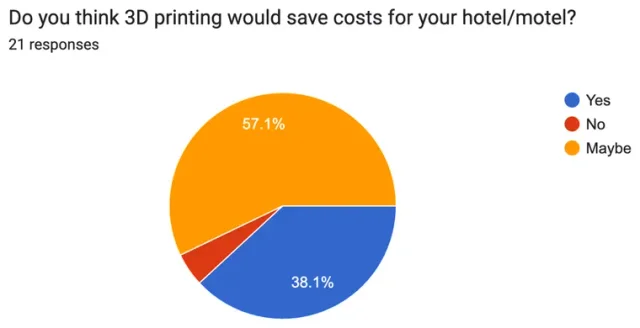
Chart values in text
- Yes — 38.1% of 21 respondents.
- Maybe — 57.1% of 21 respondents.
The remaining share is not documented in the project research, so the original chart is kept unchanged.
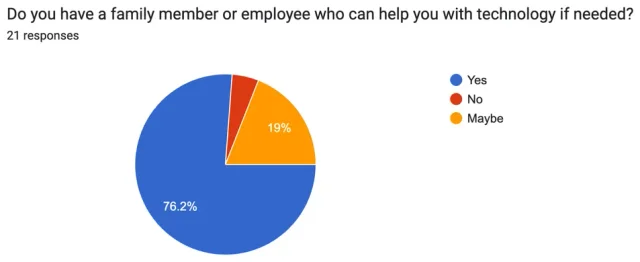
Chart values in text
- Yes, someone can help with technology — 76.2% of 21 respondents.
Only the 76.2% figure is documented in the project research, so the original chart is kept unchanged.
What the Problem Looks Like at One Property
My family’s motel has 24 rooms. I used our own property to compare recurring replacement needs, retail prices, printing costs, and travel time.
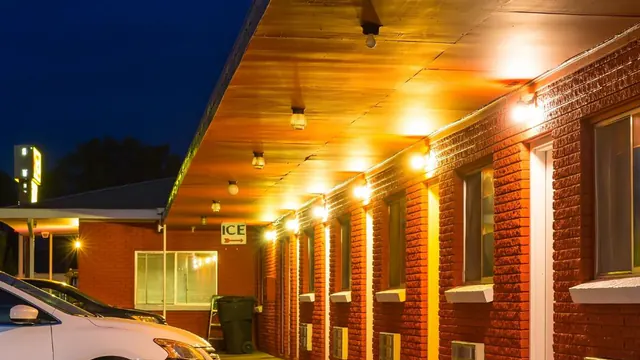
The Property
Retail vs. Print Cost
| Item | Retail / Supplier Cost | 3D Print Cost |
|---|---|---|
| Toilet handle | $11.79+ depending on type | About $1.21 |
| Shower soap holder | About $17.49; some options much higher | $1.30 |
| Mirror clamp | About $2–$5; correct size can be difficult to find | $0.16 |
| 6-inch vase | About $10 average | $1.50 |
| Room sign | About $25 average | $1.25 |
Toilet handles at the motel generally need replacement about once a year because the metal rusts in the water. The motel already uses 3D-printed soap holders and vases, while mirror clamps are a useful example of a part that can be difficult to source in the exact size needed.
What I Asked Hotel & Motel Owners
The questions were grouped around the property, the items that break, the money owners spend, access to parts, and their comfort with technology.
- What state is your hotel/motel in?
- What is the name of your hotel/motel? (Optional.)
- How many rooms does your hotel/motel have?
- Is the hotel independently owned, family-owned, or part of a larger group?
- What small items do you most often buy, replace, or repair?
- How often do you replace those items?
- Are the broken parts usually universal, or are they specifically branded to the hotel?
- If you already have a 3D printer, what do you print?
- How much do you spend on small replacement items?
- On an average trip to the hardware store, how much do you spend on hotel maintenance supplies?
- How much do you spend yearly on maintenance parts and hardware supplies?
- Do you think 3D printing would save costs for your hotel/motel?
- Are there any other hotel maintenance costs or replacement items we should know about?
- Where is the closest hardware store to your hotel/motel?
- How many days does it usually take for parts to arrive after you order them?
- Do you know about 3D printing?
- Would you consider buying a 3D printer?
- Do you have a family member or employee who can help with technology if needed?
Academic & Industry Research I Used
The survey was only one part of the project. I also looked for research that could explain why small maintenance items matter and whether local 3D printing can actually create economic value.
Life-Cycle Economic Analysis of Distributed Manufacturing with Open-Source 3-D Printers
The project notes highlight the study’s finding that one 3D-printing repository was associated with more than $60 million per year in offset consumer purchases and that consumers can create higher-value items for less than comparable commercial products.
Emergence of Home Manufacturing in the Developed World: Return on Investment for Open-Source 3-D Printers
The paper was used to support the idea that consumer open-source printers can produce enough value to become financially worthwhile investments.
Environmental Life Cycle Analysis of Distributed Three-Dimensional Printing and Conventional Manufacturing of Polymer Products
The project notes cite results showing that distributed manufacturing can reduce cumulative energy demand for some polymer products by 41–64% under the studied conditions.
Maintenance and Maintenance Management Systems in Accommodation
Used to connect small equipment and fixture reliability with hotel service quality and the operational burden of keeping property systems working.
Hotel Maintenance Management: Strategies and Challenges
Used to examine in-house versus outsourced maintenance and how cost pressures affect maintenance strategy.
Revitalizing Communities: The Economic Impact of Rural Tourism Development
Used as background for the infrastructure and procurement challenges that can affect smaller lodging businesses in rural markets.
Can Independent Hotels Survive? A Case Study of Technology and Industry Change
Used to frame 3D printing as one example of how family-operated businesses can adopt new technologies to lower costs and remain competitive.
HospitalityNet, ENERGY STAR Lodging Resources & AAHOA
HospitalityNet cost-saving strategies · ENERGY STAR lodging resources · AAHOA background
Three Ideas That Tie the Research Together
Digital Inventory
Instead of storing every physical replacement part, a hotel can keep digital model files and print selected items when they are needed.
Distributed Manufacturing
Production happens close to where an item is used instead of at a distant factory followed by shipping and retail distribution.
Frugal Innovation
Small businesses use accessible technology and practical local solutions to solve recurring problems at lower cost.
Want the Practical Version?
The research explains why I pursued the project. The free guide explains how a hotel or motel owner can actually get started.
View the 3D Printing Guide